Connect
Everything, in one place
Excel files, CRMs and scattered tools, brought together.
A shared operational platform connecting people, places, objects, documents, data and process flows.
7,883 infrastructures mapped1,345 health facilities followed over time4,341 questionnaires across 34 provincesSee the real work
The first cycle structures the work: people, places, objects, relationships and observations.
Capture data from people, systems and the field.
Link assets and relationships to build shared context.
Reveal what is happening and what it means.
Take action and track outcomes in the bigger picture.
Excel files, CRMs and scattered tools, brought together.
From one data point to the whole picture.
Each cycle reveals what one alone cannot.
From public programmes and field research to private production systems, every operation needs a reliable picture of what is happening.
GPS, photographs, questionnaires, water-quality tests and metadata brought together over 24 months to create a detailed infrastructure picture.
Read the census case studyMore than 6,000 interviews across successive waves, with information made available through 14 interactive dashboards.
Read the monitoring case studyFourteen tailored questionnaires combined field evidence, GPS and time stamps, live monitoring and structured analysis across multiple programme areas.
See all real workProducts, suppliers, orders, production, quality, stock, shipping and operational documents coordinated in one working environment.
Read the production case studyGPS and time stamps, selected audio, response monitoring, completion times and callback controls can make field collection easier to supervise.
See the platformInfrastructure data could then be compared by condition, maintenance, water quality, access, geography and other factors as new questions emerged.
Read the census case studyThe second cycle starts from what the first one made visible.
The first cycle structures the work: people, places, objects, relationships and observations. When new work is added to the same structure, it creates history.
People, places, objects and relationships already have a place.
A visit, order, survey, transfer or event extends what is already known.
The same structure can now be compared across time, places, teams, products or programme areas.
History and context are already there. The next cycle can examine change, exceptions and new questions.
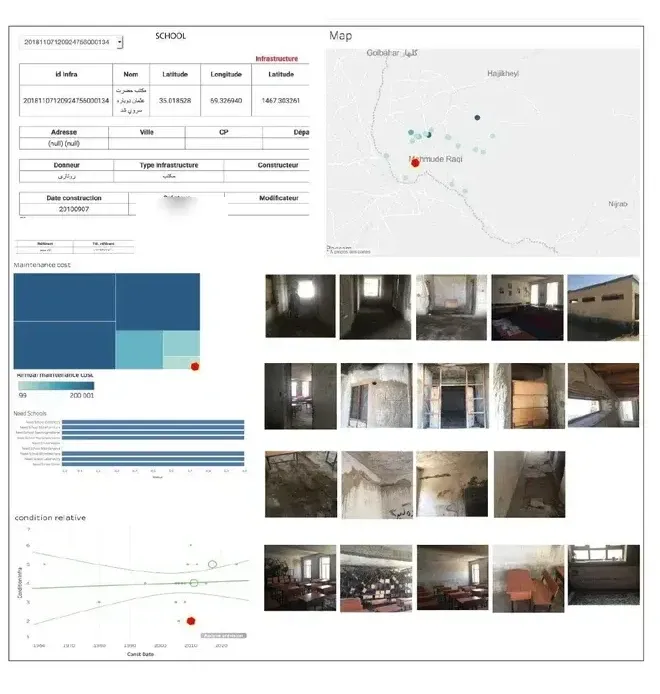
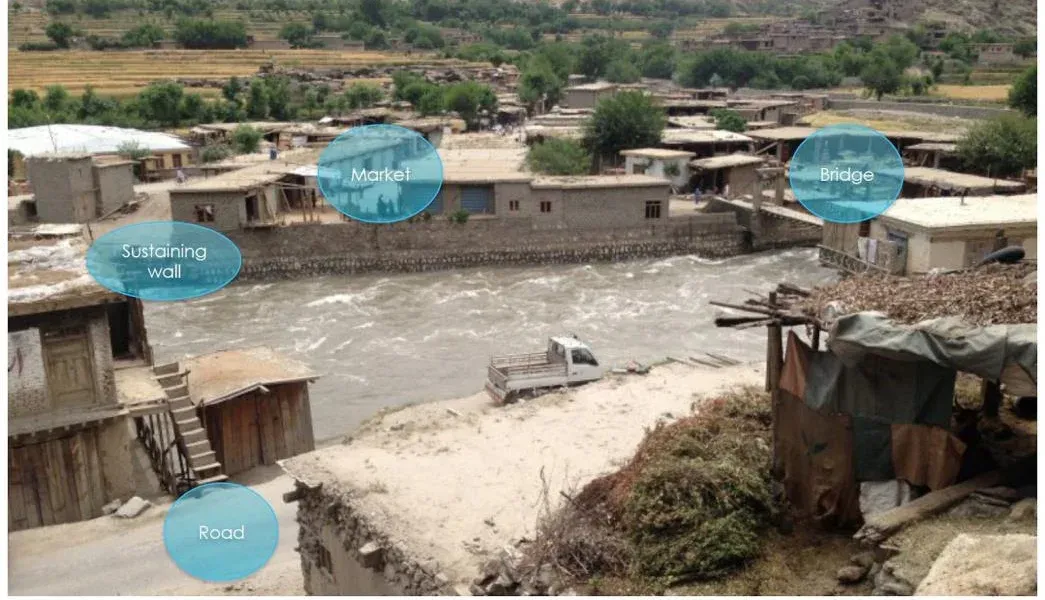
7,883 infrastructures · 24 months · GPS + photographs + field data
The first task was to build a reliable geolocated census. Once the information had a consistent structure, the same dataset could be revisited from new angles: condition, maintenance, water quality, access, geography and other questions that emerged later.
Explore the case study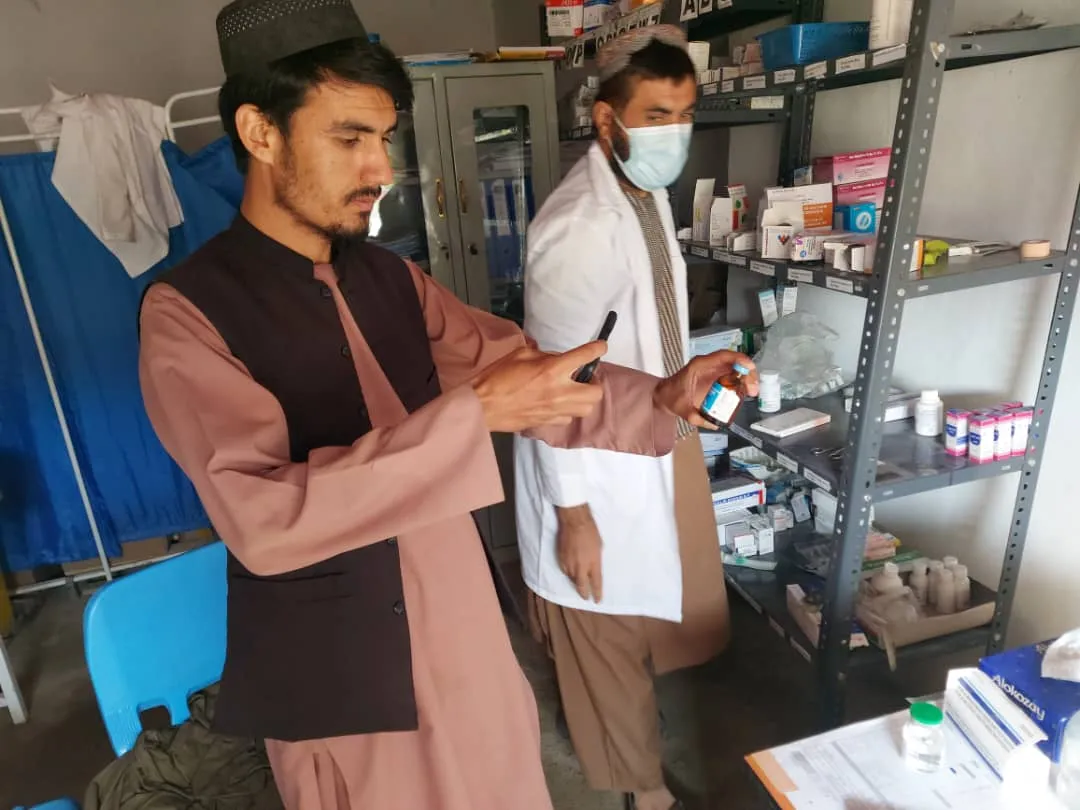
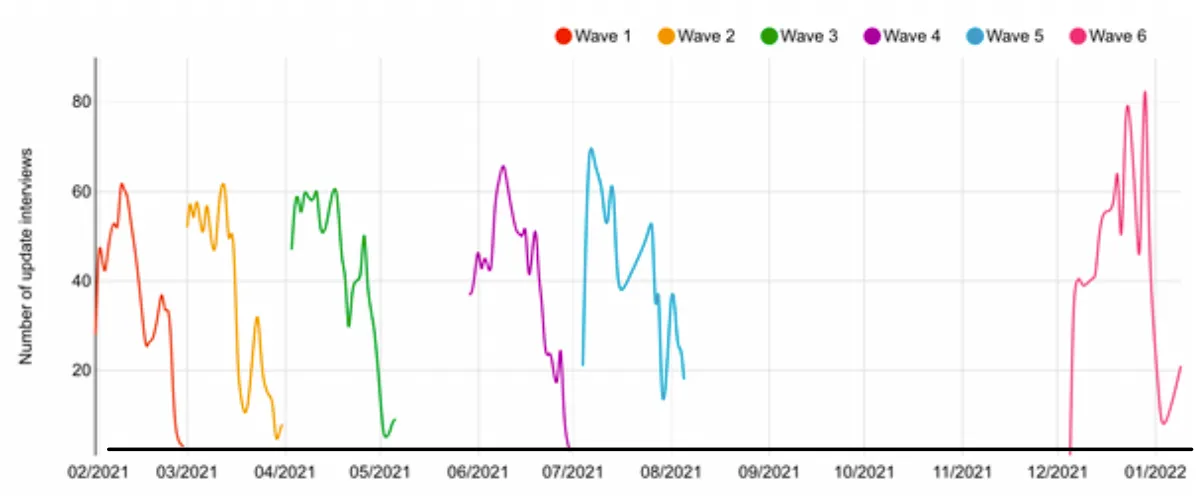
6,000+ interviews · five monitoring waves + two pilots · 14 dashboards
The same monitoring structure was reused across successive waves. That created history: changes in services, resources and operating conditions could be compared over time.
Explore the monitoring system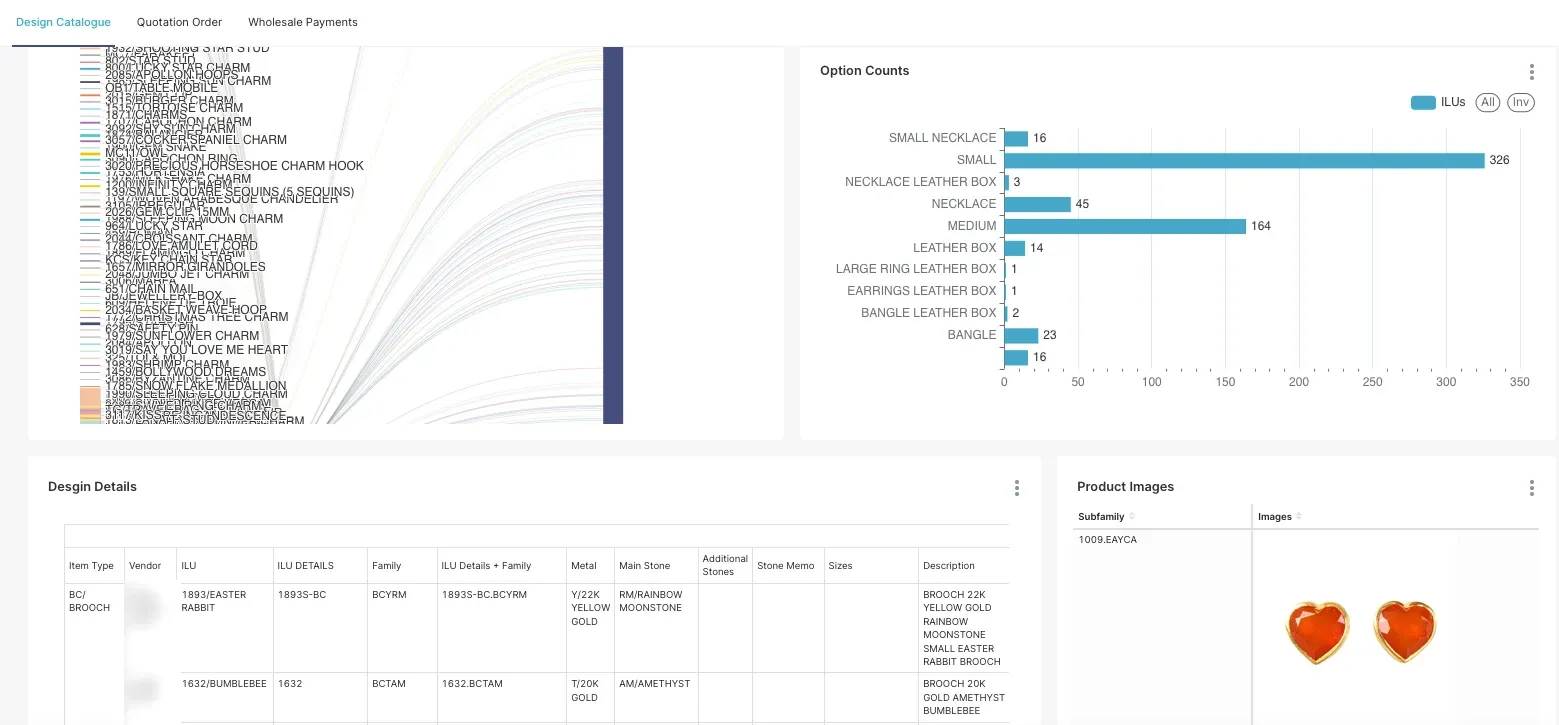
Used across several companies · production · stock · shipping
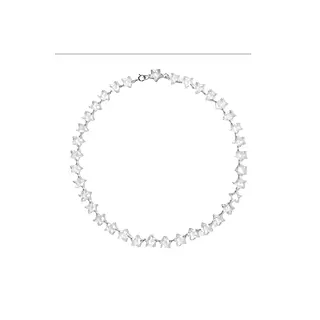
Design requirements, suppliers, orders, production status, stock, shipments and operational documents remain connected in the same working structure. Each new event adds to the history.
Explore production systemsStart with the part of the work that is difficult to see clearly today.
A first cycle starts by defining what matters, building the picture, making sense of it and using what you learn.
How VoxMapp works with your team